Logs
Langflow produces logs for individual flows and the Langflow application itself using the structlog library for logging.
By default, OSS Langflow writes logs to stdout. To write logs to a file, set LANGFLOW_LOG_FILE to the desired path.
Log storage
The LANGFLOW_CONFIG_DIR environment variable controls where Langflow stores its configuration and data files. The default location depends on your operating system:
-
Langflow Desktop:
- macOS:
/Users/<username>/Library/Logs/com.LangflowDesktop - Windows:
C:\Users\<username>\AppData\Local\com.LangflowDesktop\logs
- macOS:
-
OSS Langflow (all installation methods, including
uv pip installandgit clone):- macOS:
/Users/<username>/Library/Caches/langflow - Linux:
/home/<username>/.cache/langflow - Windows/WSL:
C:\Users\<username>\AppData\Local\langflow\langflow\Cache
- macOS:
To customize log storage locations and behaviors, set the following Langflow environment variables in your Langflow .env file, and then start Langflow with uv run langflow run --env-file .env:
| Variable | Format | Default | Description |
|---|---|---|---|
LANGFLOW_CONFIG_DIR | String | Varies | Set the Langflow configuration directory where files and logs are stored. Default path depends on your installation, as described in the preceding list. |
LANGFLOW_ENABLE_LOG_RETRIEVAL | Boolean | False | Enables retrieval of logs from your Langflow instance with Logs endpoints. |
LANGFLOW_ENVIRONMENT | String | Not set | Adds an environment field to every JSON log record when set (staging, production, etc.). Omitted otherwise. |
LANGFLOW_LOG_ENV | String | default | Primary log format controller. container or container_json: JSON format via JSONRenderer. container_csv: Key-value format. default or unset: uses LANGFLOW_PRETTY_LOGS to determine format. See JSON log format. |
LANGFLOW_LOG_FILE | String | Not set | Sets the log file storage location. For example, LANGFLOW_LOG_FILE=path/to/logfile.log. If not set, logs are written to stdout. |
LANGFLOW_LOG_FORMAT | String | Not set | Set to key_value for key-value format or console for ConsoleRenderer. Only applies when LANGFLOW_LOG_ENV=default and LANGFLOW_PRETTY_LOGS=true. |
LANGFLOW_LOG_LEVEL | String | ERROR | Global log level. One of DEBUG, INFO, WARNING, ERROR, or CRITICAL. |
LANGFLOW_LOG_LEVELS | String | Not set | Per-logger level overrides as name=LEVEL,name=LEVEL. Overrides LANGFLOW_LOG_LEVEL for specific loggers without changing the global default. Malformed entries raise a UserWarning at startup. Example: sqlalchemy.engine=WARNING,httpx=INFO. |
LANGFLOW_LOG_REDACT_KEYS | String | Not set | Comma-separated extra keys to scrub from JSON log records, on top of the defaults (password, api_key, token, authorization, cookie, etc.). |
LANGFLOW_LOG_RETRIEVER_BUFFER_SIZE | Integer | 10000 | Buffer size for log retrieval when LANGFLOW_ENABLE_LOG_RETRIEVAL=True. Must be greater than 0. |
LANGFLOW_LOG_ROTATION | String | 1 day | Controls log file rotation by time (1 day, 12 hours, 1 week) or size (10 MB, 1 GB). Set to None to disable rotation. |
LANGFLOW_LOG_TRACE_LOCALS | Boolean | false | Include frame locals in structured tracebacks. Off by default because locals can leak secrets; enable only for local debugging. |
LANGFLOW_NATIVE_TRACING | Boolean | true | Enables the tracer to record execution traces in the Langflow database for use in Trace View. Set to false to disable. |
LANGFLOW_PRETTY_LOGS | Boolean | True | Controls output format when LANGFLOW_LOG_ENV=default or unset. true: ConsoleRenderer (human-readable). false: JSON format. |
LANGFLOW_SERVICE_NAME | String | langflow | Value of the service field on every JSON log record. Used as a label by log aggregators. See Grafana and Loki. |
LANGFLOW_VERSION | String | Not set | Adds a version field to every JSON log record when set. Omitted otherwise. |
View logs in real-time
By default, OSS Langflow writes logs to stdout. To write logs to a file that you can tail, do the following:
-
Set
LANGFLOW_LOG_FILEto a file path in your.envfile:LANGFLOW_LOG_FILE=/path/to/langflow.log -
Start Langflow with your
.envfile:uv run langflow run --env-file .env -
Change to the directory where you set
LANGFLOW_LOG_FILE:- macOS
- Windows
cd /Users/**USERNAME**/Library/Caches/langflowcd C:\Users\**USERNAME**\AppData\Local\com.LangflowDesktop\logs -
Tail the log file:
- macOS
- Windows
tail -f langflow.logGet-Content -Wait -Path langflow.logIf you don't see new log entries, check that Langflow is running, and perform some actions to generate logs events. You can also check the terminal where you started Langflow to see if logs are being printed there.
Flow and component logs
After you run a flow, you can inspect the logs for each component and flow run.
For example, you can inspect Message objects ingested and generated by Input and Output components.
View flow logs
In the visual editor, click Logs to view logs for the entire flow:
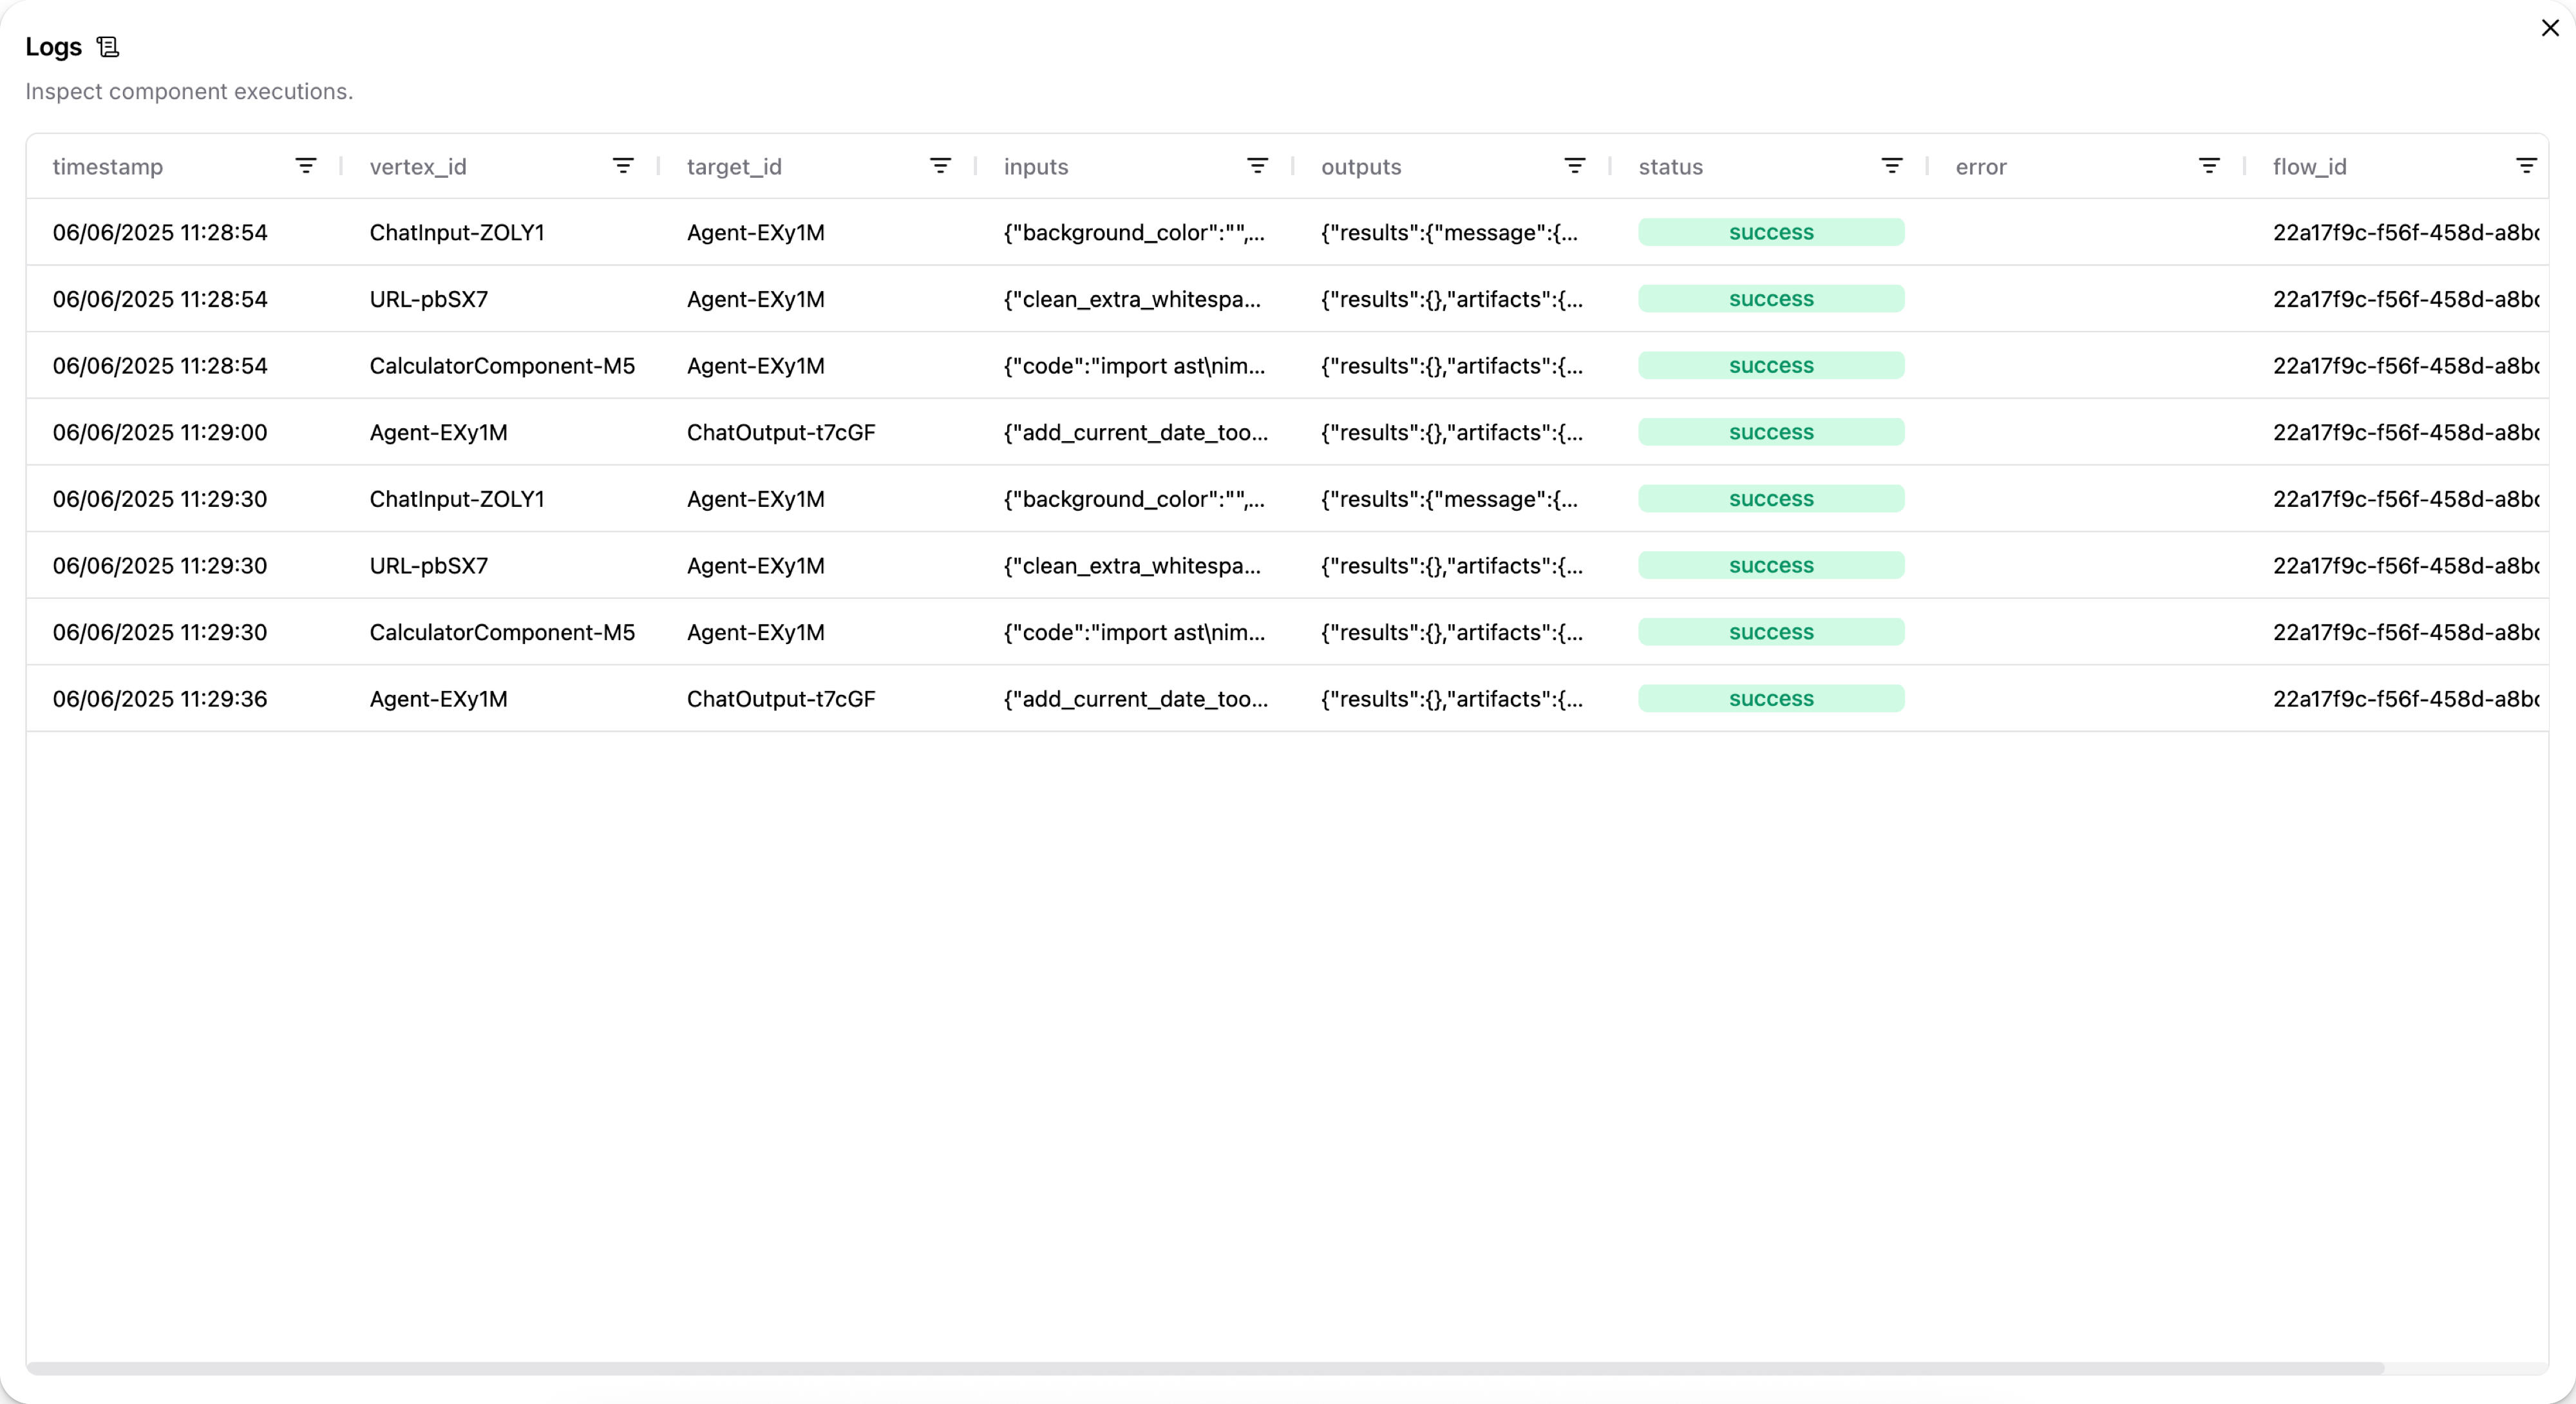
Then, click the cells in the inputs and outputs columns to inspect the Message objects.
For example, the following Message data could be the output from a Chat Input component:
    "messages": [
    {
        "message": "What's the recommended way to install Docker on Mac M1?",
        "sender": "User",
        "sender_name": "User",
        "session_id": "Session Apr 21, 17:37:04",
        "stream_url": null,
        "component_id": "ChatInput-4WKag",
        "files": [],
        "type": "text"
    }
    ],
In the case of Input/Output components, the original input might not be structured as a Message object.
For example, a language model component can pass a raw text response to a Chat Output component that is then transformed into a Message object.
You can find .log files for flows at your Langflow installation's log storage location.
For filepaths, see Log storage.
View chat logs
In the Playground, you can inspect the chat history for each chat session. For more information, see View chat history.
View output from a single component
When debugging issues with the format or content of a flow's output, it can help to inspect each component's output to determine where data is being lost or malformed.
To view the output produced by a single component during the most recent run, click Inspect output on the component in the visual editor.
Access Langflow Desktop logs
If you encounter issues with Langflow Desktop, you might need to access startup logs for debugging. Follow the steps for your operating system.
- macOS
- Windows
-
Open Terminal and run:
cd ~/Library/Logs/com.LangflowDesktop -
To open the folder and view the log files, run the command:
open . -
Locate the
langflow.logfile.
-
Open the Command Prompt (CMD), and then run the following command:
cd %LOCALAPPDATA%\com.LangflowDesktop\cache -
Open the folder and view the log files:
start . -
Locate the
langflow.logfile.
You can use the log file to investigate the issue on your own, add context to a GitHub Issue, or send it to support for debugging assistance.
The log file is only created when Langflow Desktop runs. If you don't see a log file, try starting Langflow Desktop first, then check for the log file.
Log format
By default, structlog uses ConsoleRenderer to produce human-readable output with the following structure:
For example:
2026-05-17T18:18:29Z [info ] incoming request logger=langflow.api.run flow_id=flow-718 user_id=user-4823
JSON log format
Set LANGFLOW_LOG_ENV=container to switch structlog's terminal processor to JSONRenderer, so every line written to stdout is a JSON object containing the event message, level, timestamp, logger name, exception structure, and service metadata.
A typical record in JSON mode looks like the following:
{
  "event": "incoming request",
  "level": "info",
  "logger": "langflow.api.run",
  "timestamp": "2026-05-17T18:18:29.100798Z",
  "service": "langflow",
  "version": "1.10.0",
  "environment": "production",
  "user_id": "user-4823",
  "flow_id": "flow-718",
  "authorization": "***",
  "cookie": "***",
  "request_body": {
    "input": "Tell me a joke",
    "api_key": "***",
    "session_id": "Session Apr 21, 17:37:04"
  }
}
When a log record includes an exception, the exception field contains a structured traceback instead of a plain string:
{
  "event": "flow run failed",
  "level": "error",
  "logger": "langflow.api.run",
  "timestamp": "2026-05-17T18:18:32.412Z",
  "service": "langflow",
  "exception": [
    {
      "exc_type": "ConnectionError",
      "exc_value": "upstream returned 503",
      "frames": [
        {"filename": "/app/.../runner.py", "lineno": 142, "name": "run_flow"}
      ]
    }
  ]
}
Frame locals, which are local variables at each stack frame, are intentionally excluded by default because they can contain API keys, request bodies, and environment values. Set LANGFLOW_LOG_TRACE_LOCALS=true to include them for local debugging.
Stdlib loggers
Third-party libraries that use Python's standard logging module (uvicorn, sqlalchemy, httpx, langchain, asyncio) are routed through the same JSON stream in container mode. Their original logger name is preserved on the logger field, so log queries that work for application loggers also work for library output.
OpenTelemetry trace correlation
If opentelemetry-api is installed and an active span is present, every log record automatically picks up trace_id and span_id. OpenTelemetry is not a hard dependency; if it is not installed, the processor is a no-op and nothing else changes.
See also
Was this page helpful?