Traceloop
Traceloop SDK is a lightweight instrumentation toolkit designed for LLM applications. It enables developers to automatically capture and export traces, metrics, and key observability signals from their LLM-powered workflows.
When combined with Instana, the exported telemetry data from Traceloop provides end-to-end visibility, allowing users to visualize traces, analyze performance bottlenecks, and ensure reliable operation of LLM-driven applications.
This guide demonstrates how to integrate the Instana observability platform with your Langflow application using the Traceloop SDK so you can monitor and analyze LLM performance.
Prerequisites
- Create a Traceloop API key
- Create an Instana endpoint and Instana key
- Install Langflow
Configure environment variables
-
In the root folder of your Langflow application, edit your existing Langflow
.envfile or create a new one. -
Enter the following environment variables, and then replace the placeholders with the values for your deployment or requirements:
_10TRACELOOP_API_KEY=tl_dummy_1234567890abcdef1234567890abcdef_10TRACELOOP_BASE_URL=https://otlp-magenta-saas.instana.rocks:4318_10TRACELOOP_HEADERS="x-instana-key=INSTANA_KEY"_10OTEL_EXPORTER_OTLP_INSECURE=false_10TRACELOOP_METRICS_ENDPOINT=HOST:8000_10TRACELOOP_METRICS_ENABLED=true_10OTEL_METRIC_EXPORT_INTERVAL=10000Set the necessary values for each environment variable:
-
TRACELOOP_API_KEY: A Traceloop API key to authenticate your application with Traceloop's monitoring service. You can get this from your Traceloop account dashboard.This integration uses the Traceloop SDK for instrumentation, which requires a Traceloop API key to initialize properly. If you don't have a Traceloop API key, you can proceed with the placeholder API key in the preceding example.
-
TRACELOOP_BASE_URL: The Instana endpoint URL for telemetry data collection, which is your Instana backend endpoint, such ashttps://otlp-magenta-saas.instana.rocks:4318. You can get this from your Instana configuration or by contacting your Instana administrator. -
TRACELOOP_HEADERS: Authentication headers for Instana data collection. Set this to"x-instana-key=INSTANA_KEY", replacingINSTANA_KEYwith the Instana key from your Instana setup. -
OTEL_EXPORTER_OTLP_INSECURE: Security setting for OpenTelemetry Protocol connections. Set tofalsefor secure HTTPS/TLS connections. This is recommended for production Instana SaaS endpoints. Set totruefor insecure HTTP connections during local development. -
TRACELOOP_METRICS_ENDPOINT: Separate metrics endpoint configuration, in the form ofOTEL_DC_LLM_HOST:8000. Typically set tohost.docker.internal:8000for Docker environments. Adjust the host and port based on your deployment setup. -
TRACELOOP_METRICS_ENABLED: Boolean to enable metrics collection. Set totrueto activate metrics gathering. -
OTEL_METRIC_EXPORT_INTERVAL: Interval in milliseconds for metrics export. Set to10000for 10-second export intervals, or adjust based on your monitoring requirements.
-
-
Make sure the OpenTelemetry Data Collector (OTel DC) is running and correctly configured. Open your Collector's
config.yamlfile, enter the following configuration, and then replace the placeholder values with the values from your data collector setup or requirements:_10llm.application: "LLM_DC"_10instances:_10- otel.agentless.mode: true_10# Example endpoint: https://otlp-magenta-saas.instana.rocks:4318_10otel.backend.url: "INSTANA_ENDPOINT"_10otel.backend.using.http: false_10callback.interval: 10_10otel.service.name: "DC1"_10otel.service.port: 8000_10currency: "USD"This configuration enables the OTel Collector to operate in agentless mode and route telemetry data to your Instana backend with proper service identification and collection intervals for effective monitoring integration.
Start Langflow with Traceloop environment variables
Launch your Langflow application with your .env file:
_10uv run langflow run --env-file .env
Traceloop automatically begins monitoring and collecting telemetry data from your LLM applications.
Verify the integration
To verify that observability is working correctly:
-
Run a flow in Langflow to generate traffic.
-
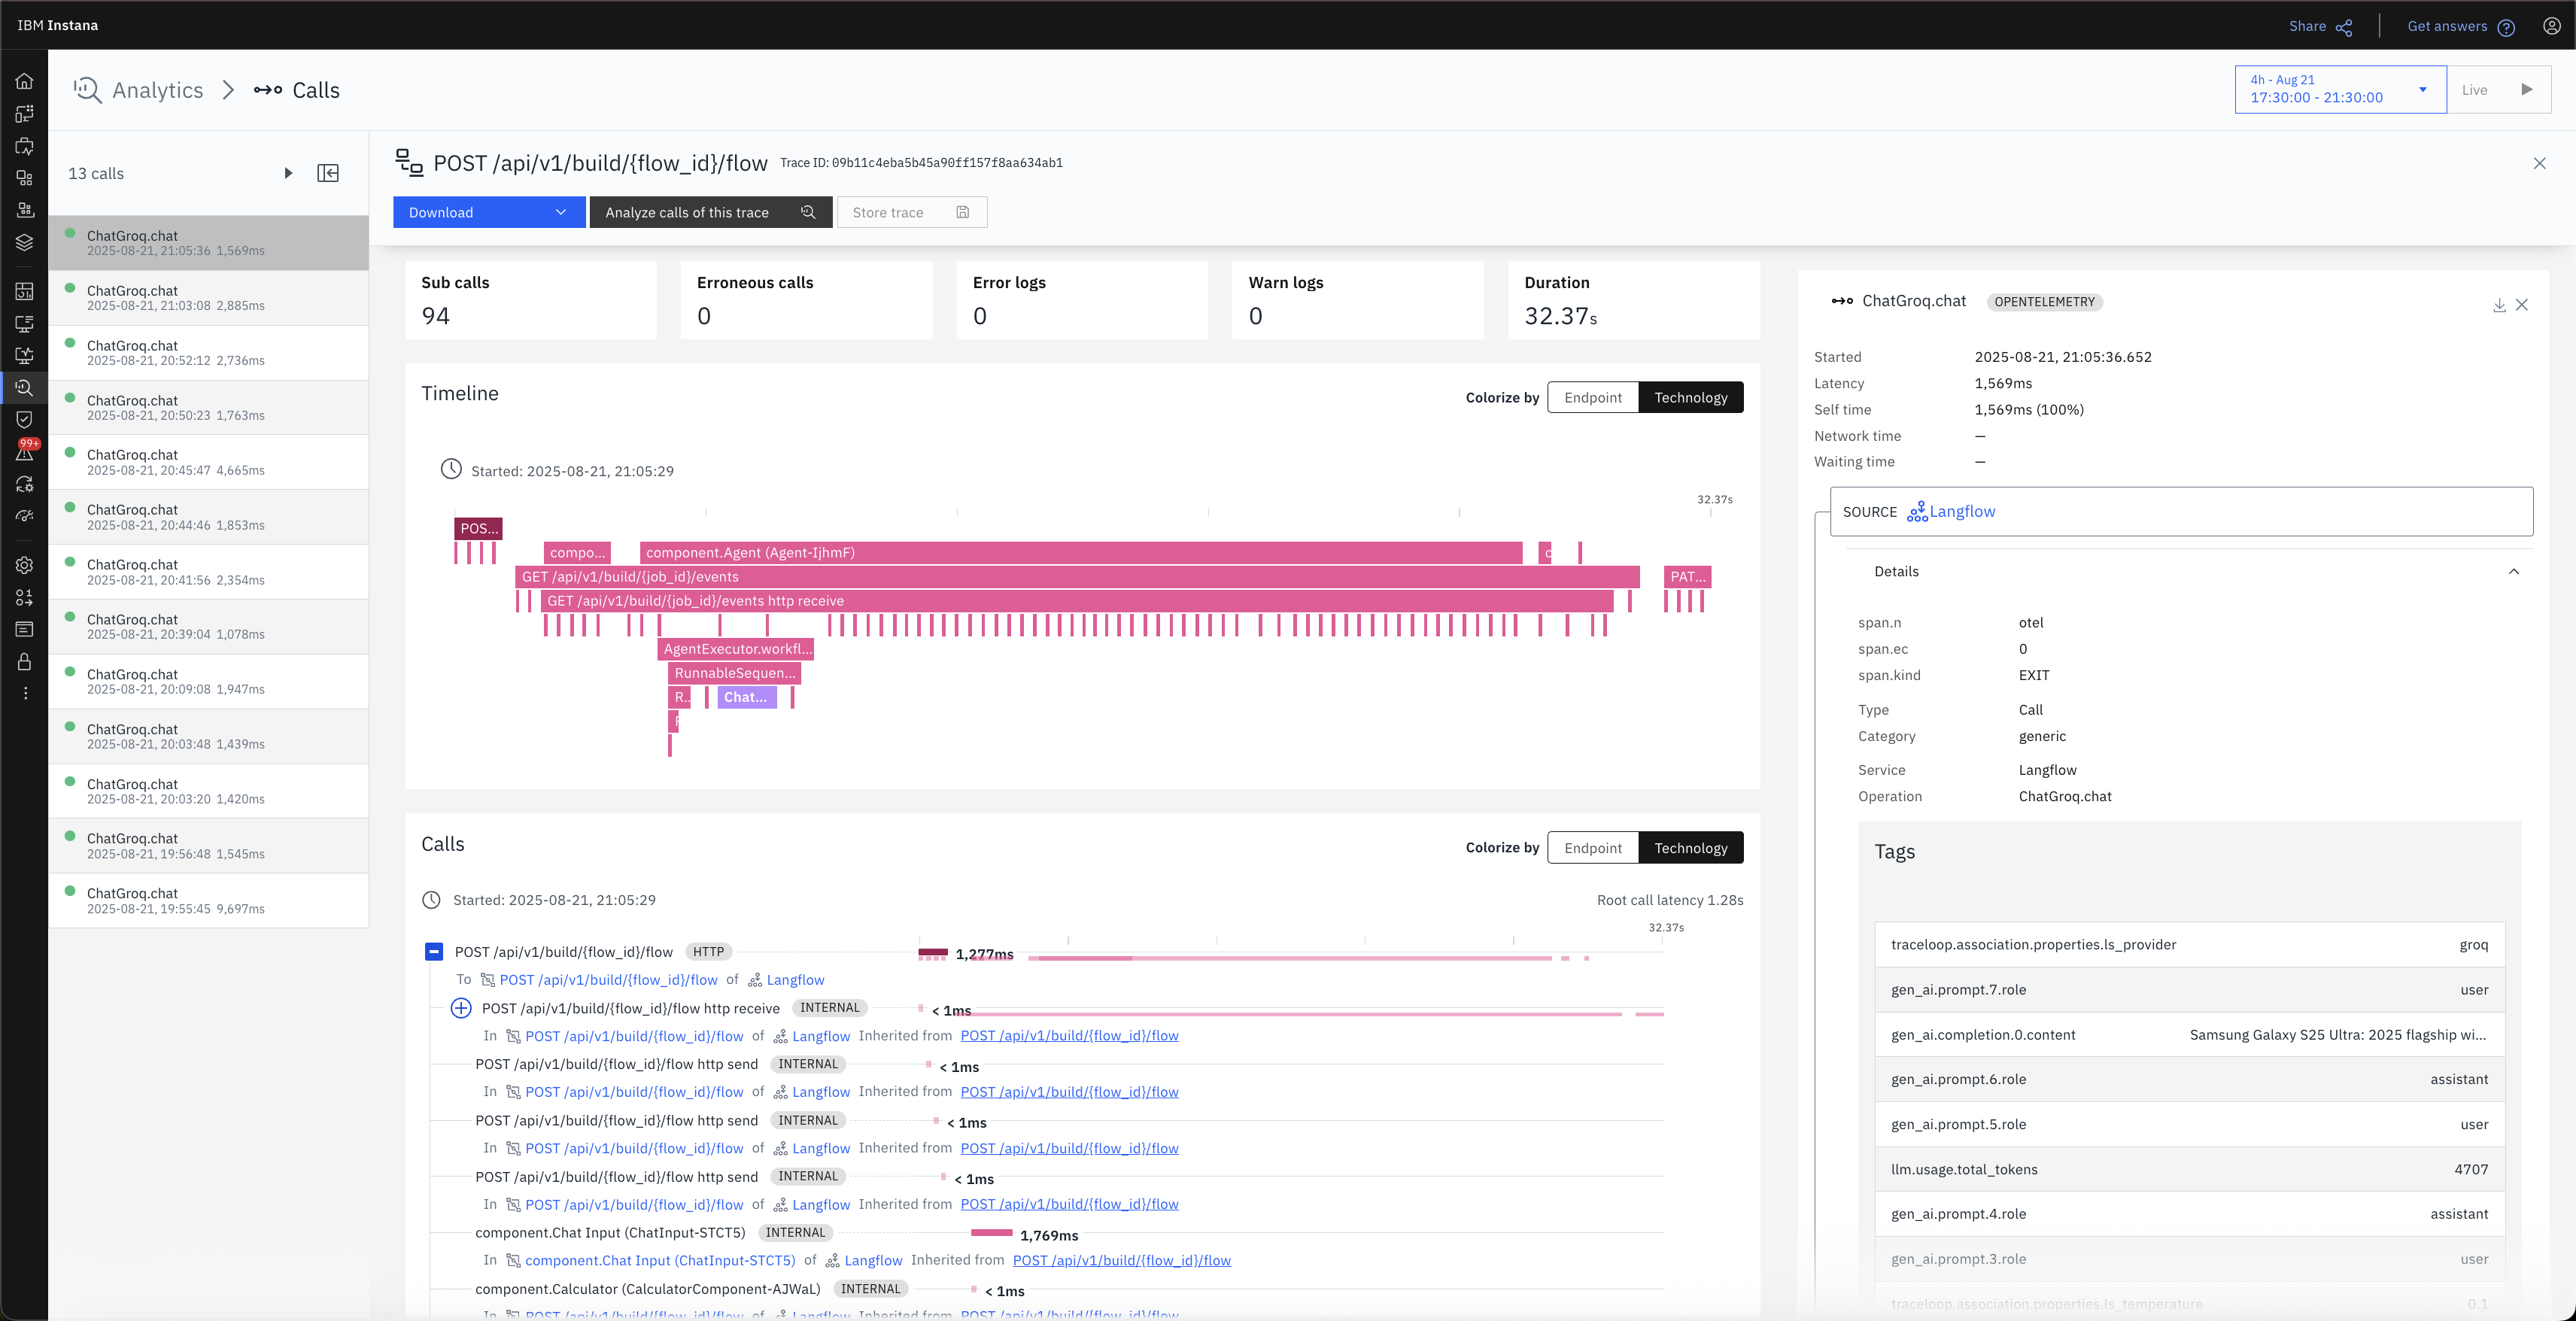
To view traces in Instana, open Instana and click Applications.
-
In Services, search for
Langflow. -
Click Langflow to view and analyze the associated calls.
-
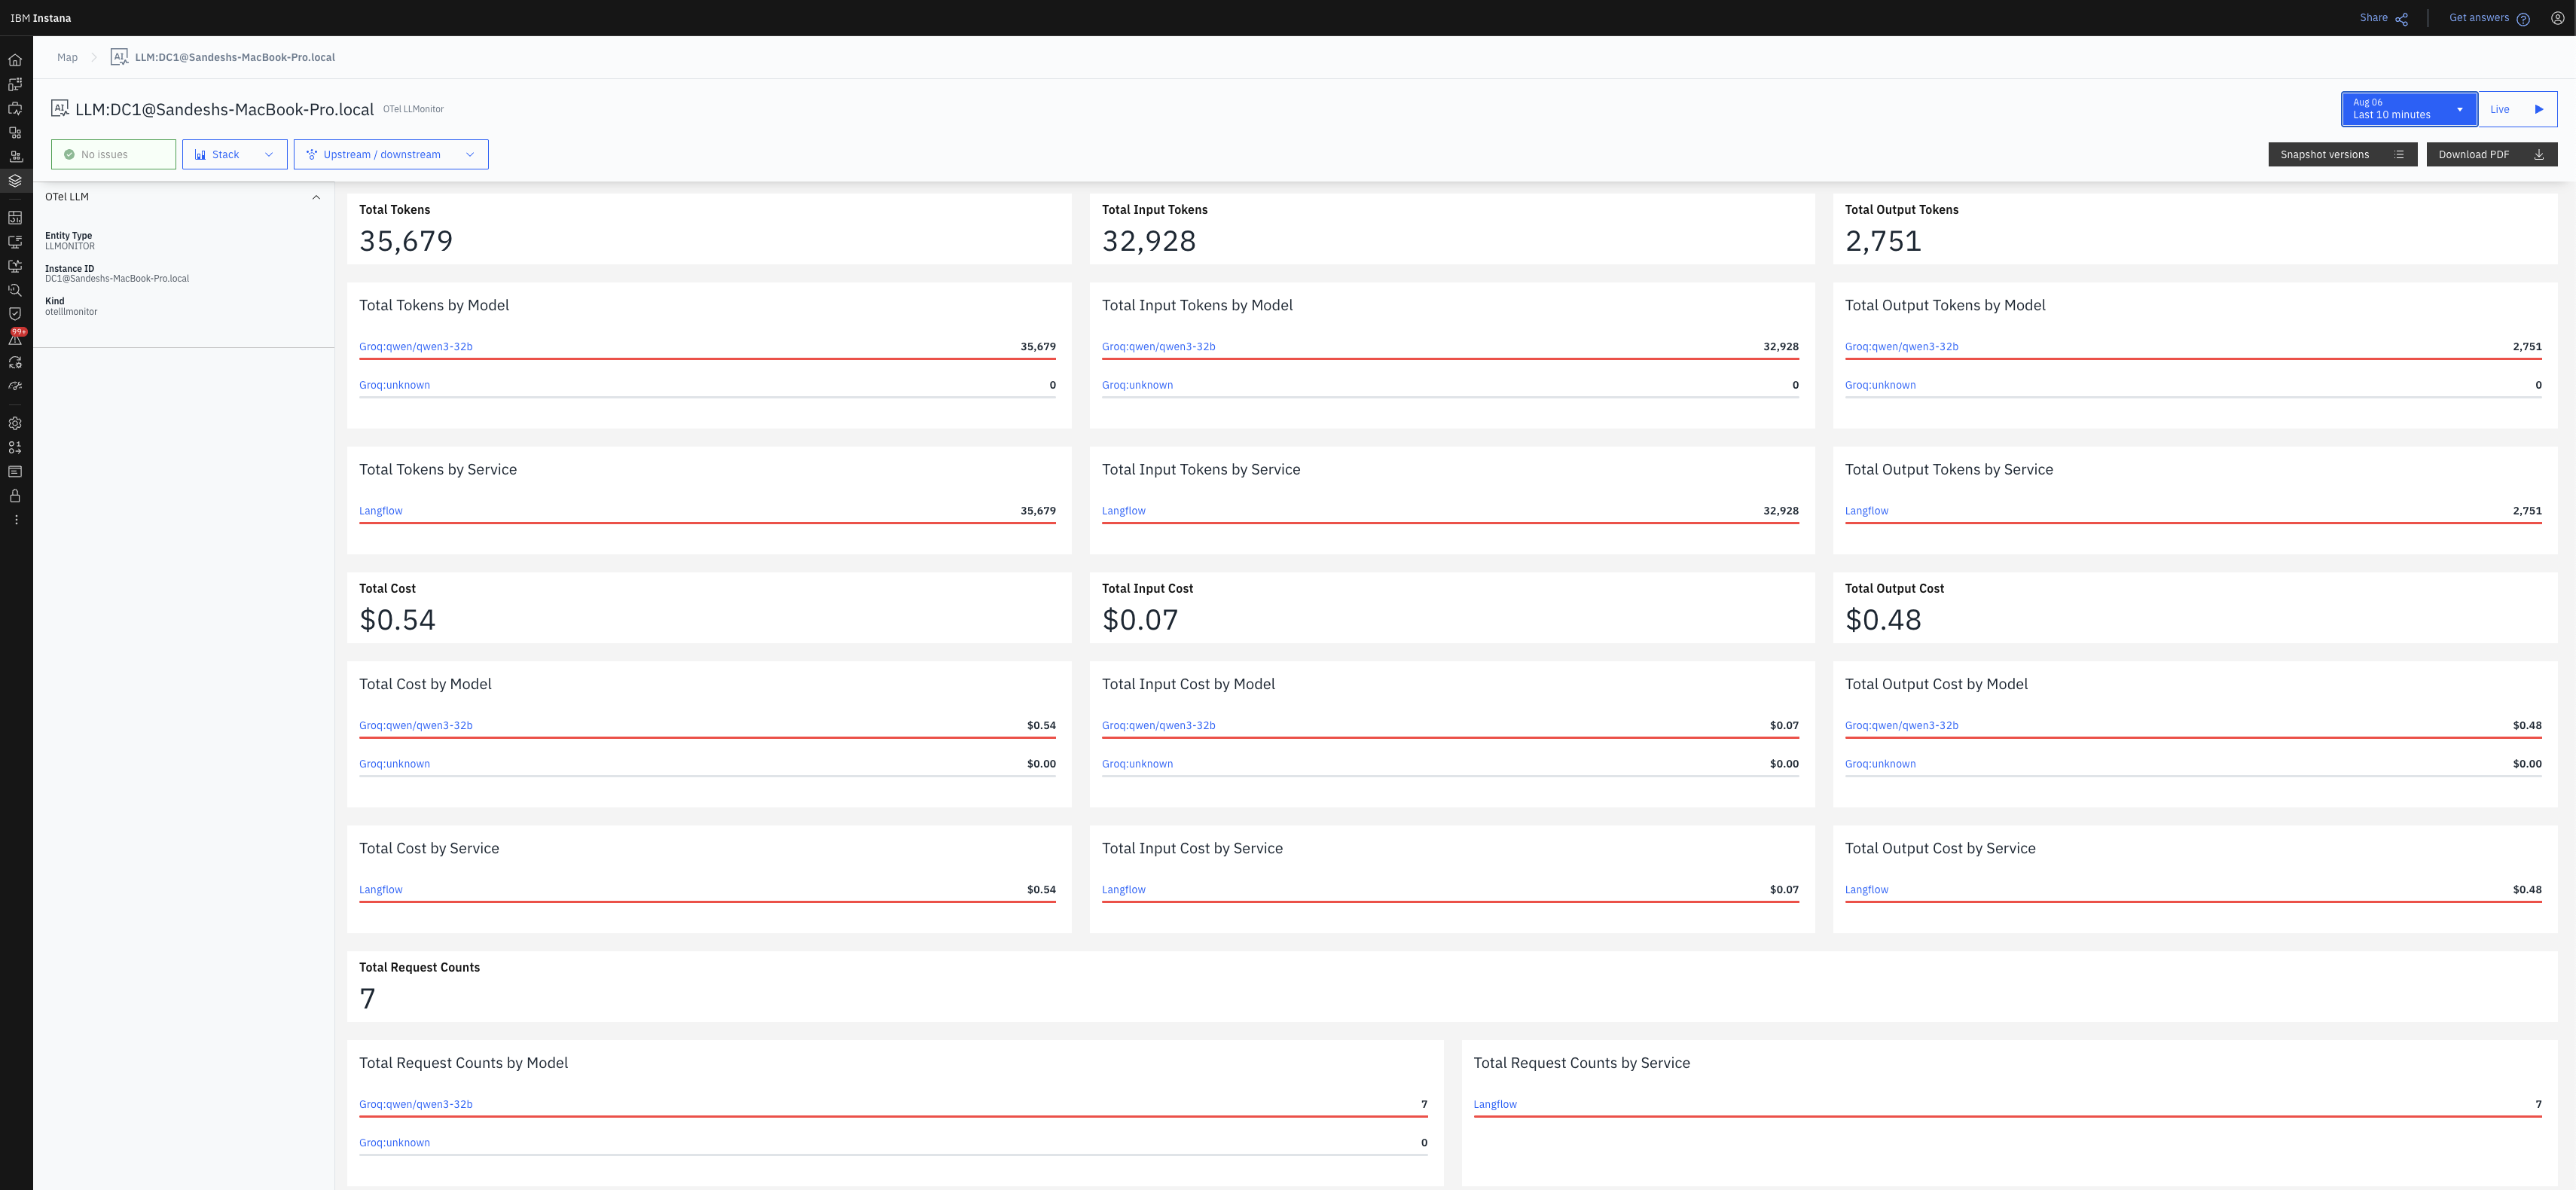
To view metrics in Instana, open Instana and click Infrastructure.
-
In Analyze Infrastructure, click Otel LLMonitor.
-
To view your Metrics dashboard, click
LLM:DC1@your_machine_name.local.